01 / BOARD REVIEW · 9 SLIDES
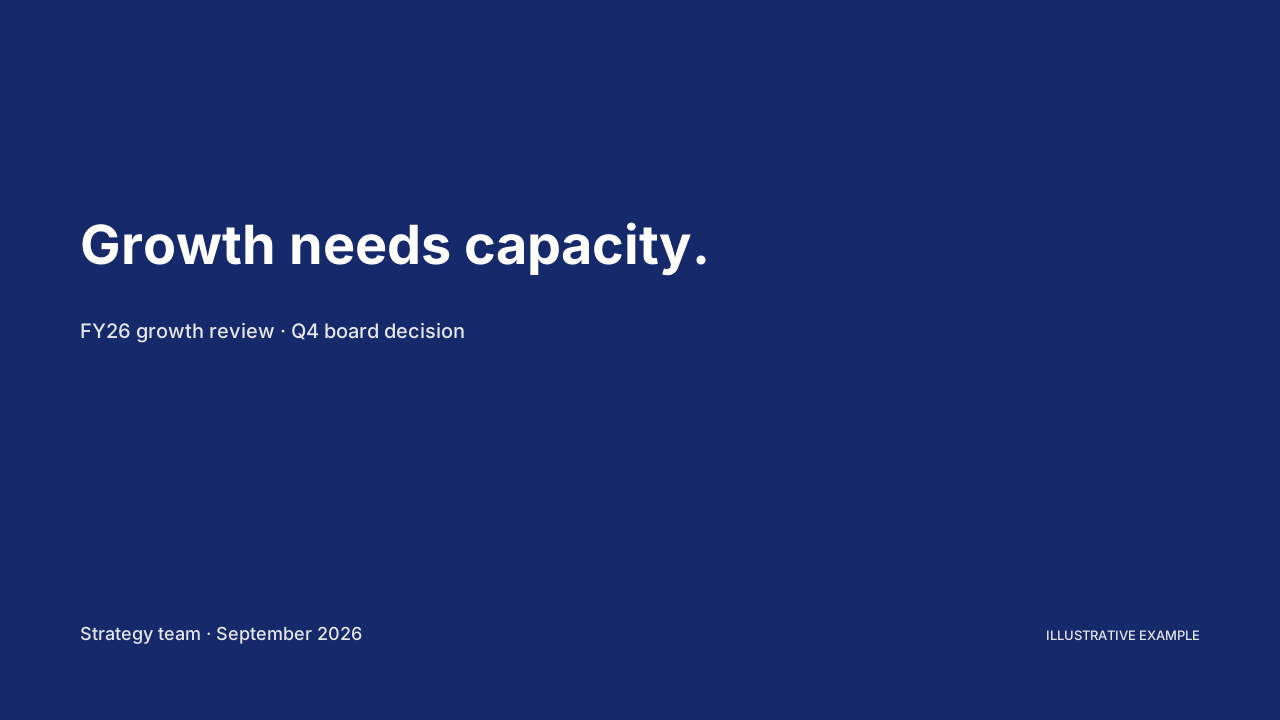
Explain the numbers. Make the case.
Connect growth drivers, adoption and capacity to the decisions your board needs to make.
View the full deck · PDF ↗Add this skill to your AI agent. Turn business notes into clear charts, presentation decks and one-page PDF briefs.
See it in action Get the free skill
Works with Claude Code, Codex & Cursor.
Explore the examples. No sign-up needed.
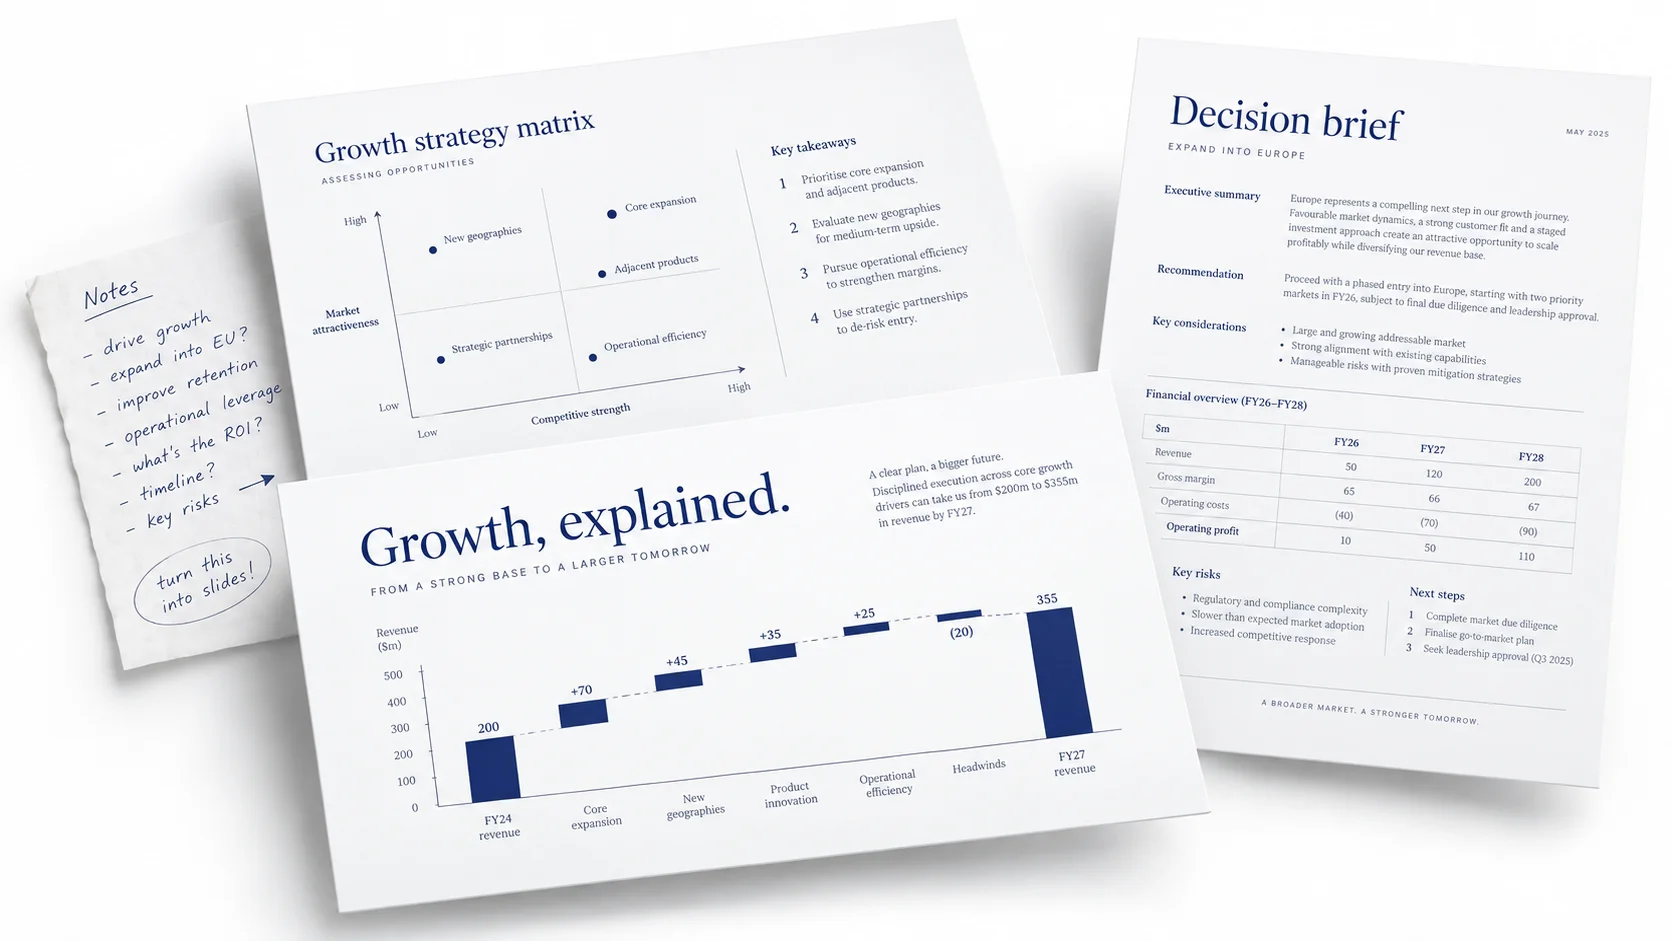
22chart & slide patterns
6complete deck templates
4ways to present your work
MITfree to use & adapt
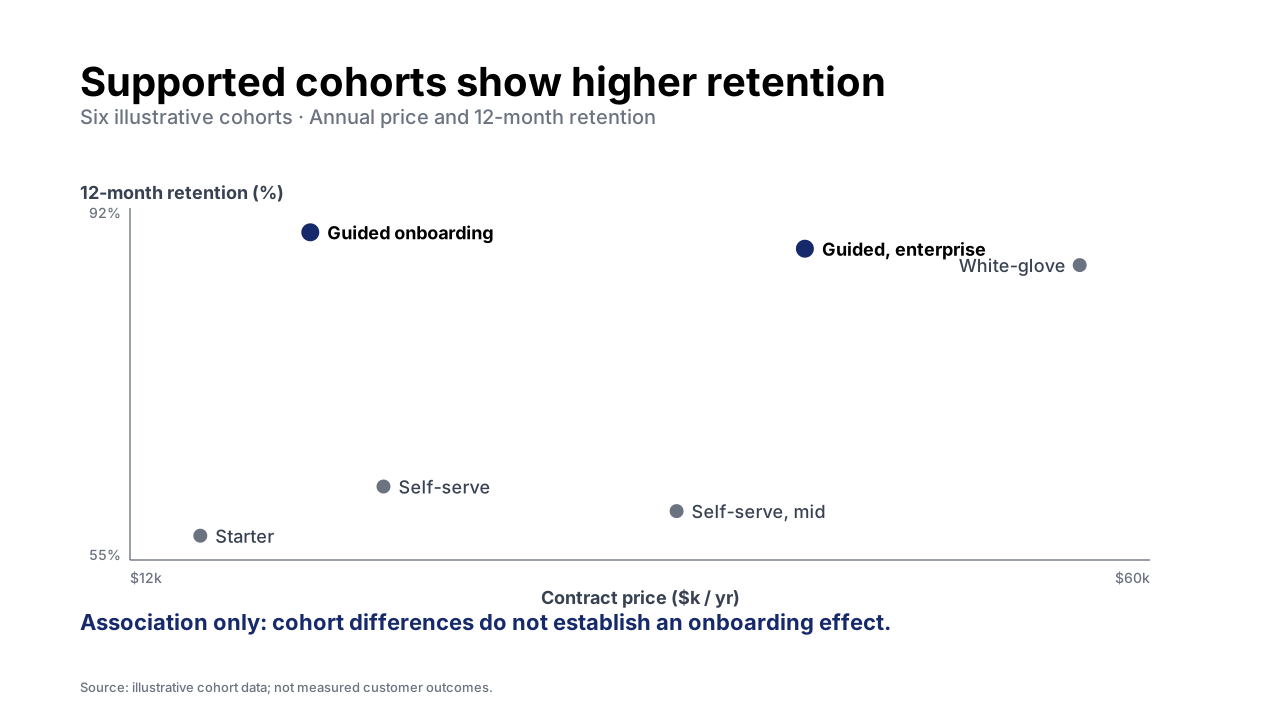
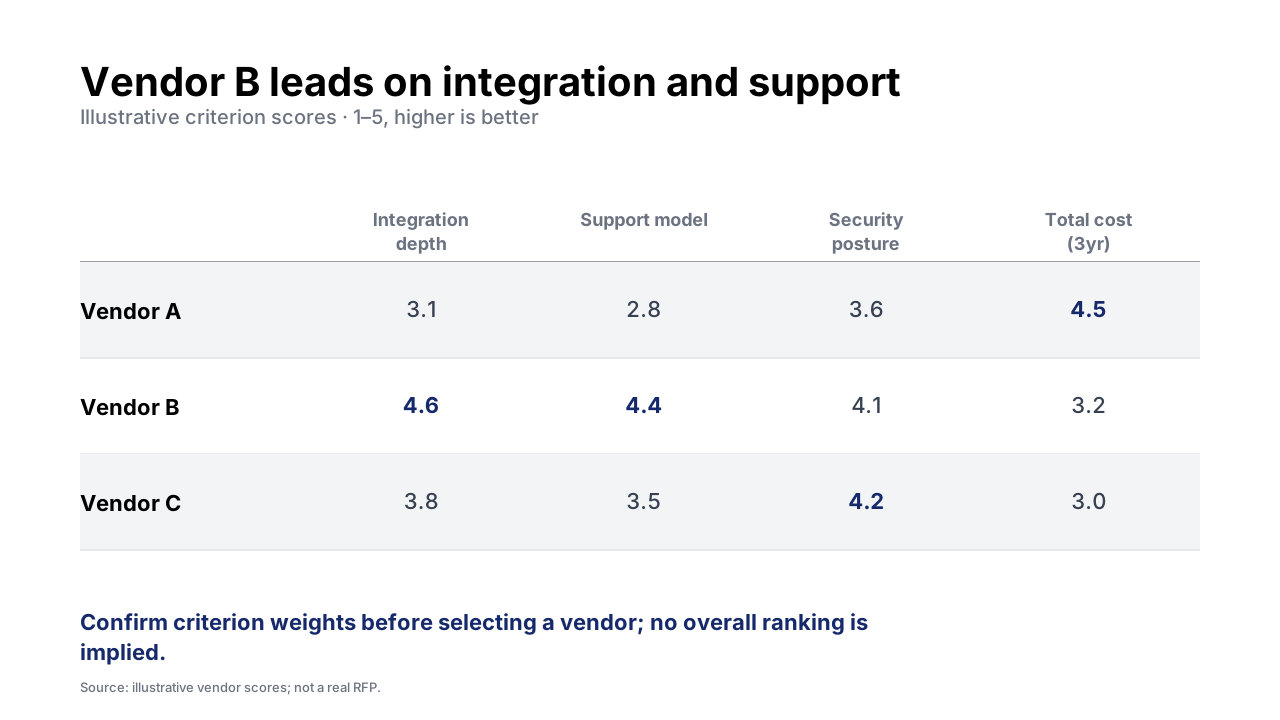
Choose a business question. Compare the rough notes with the actual slide output.
q4 board update
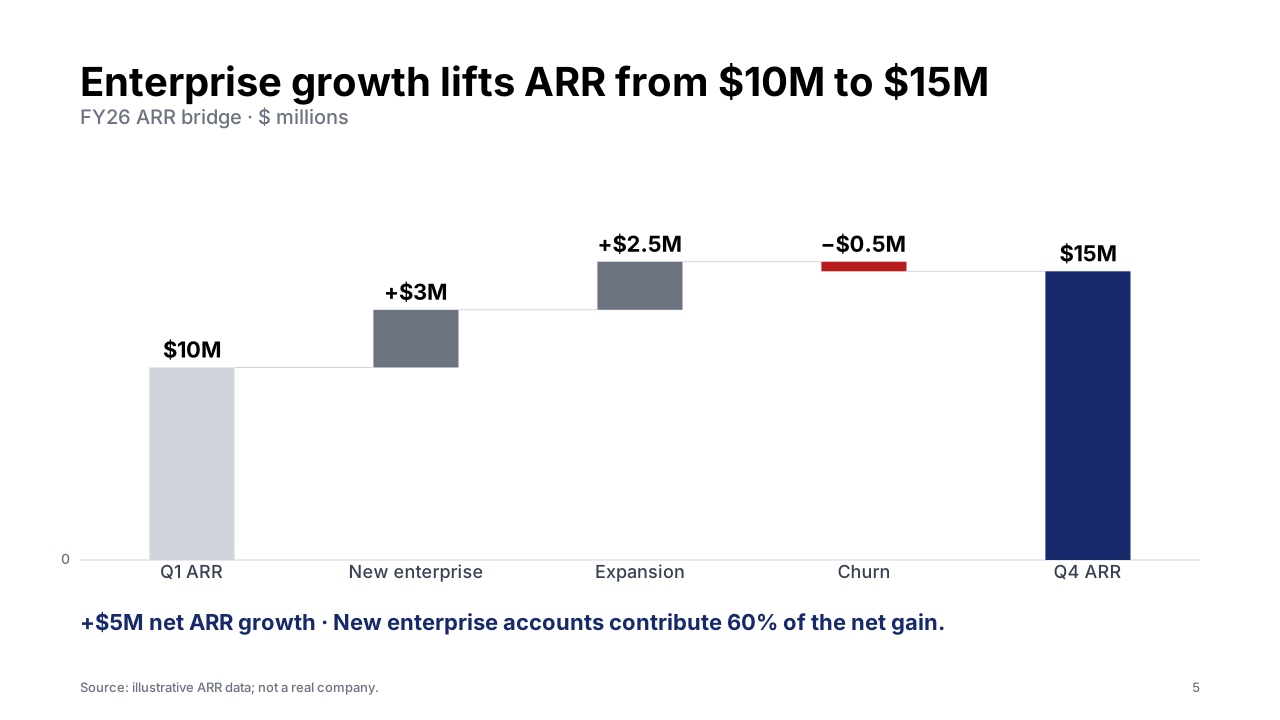
arr was $10m, now $15m
new enterprise +$3m
expansion +$2.5m
churn -$0.5m

need to explain the growth
Illustrative input
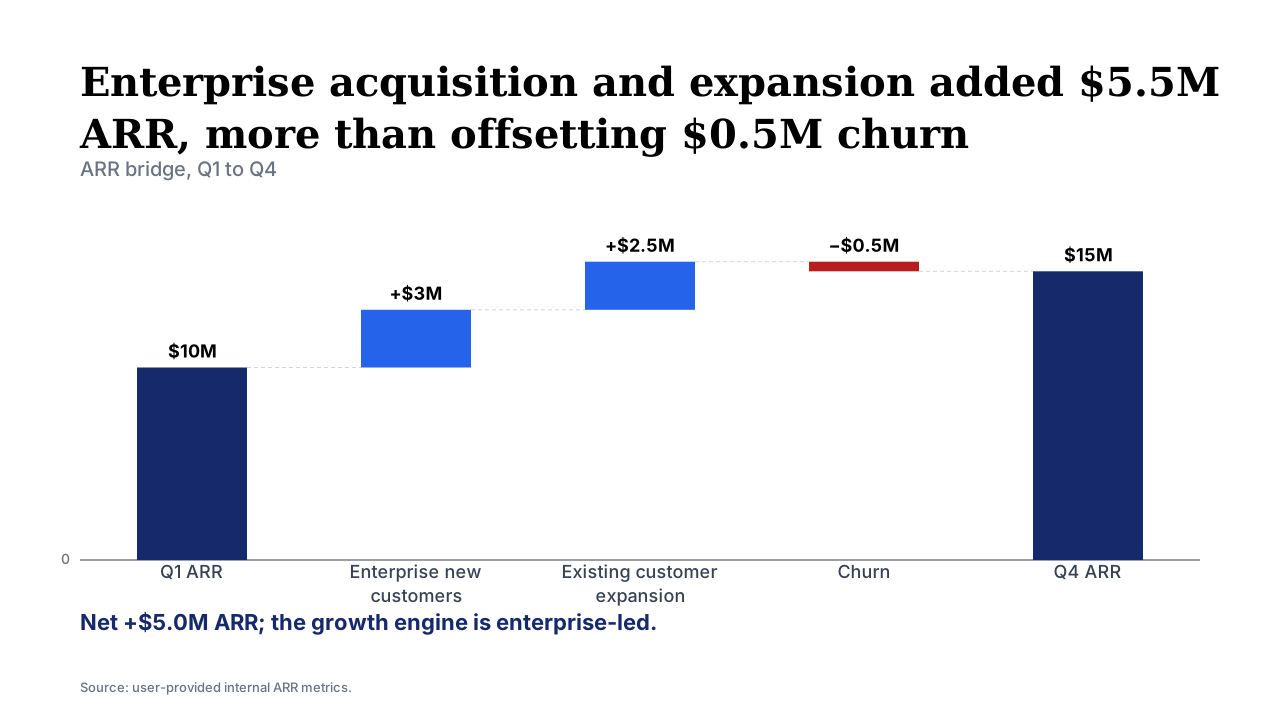
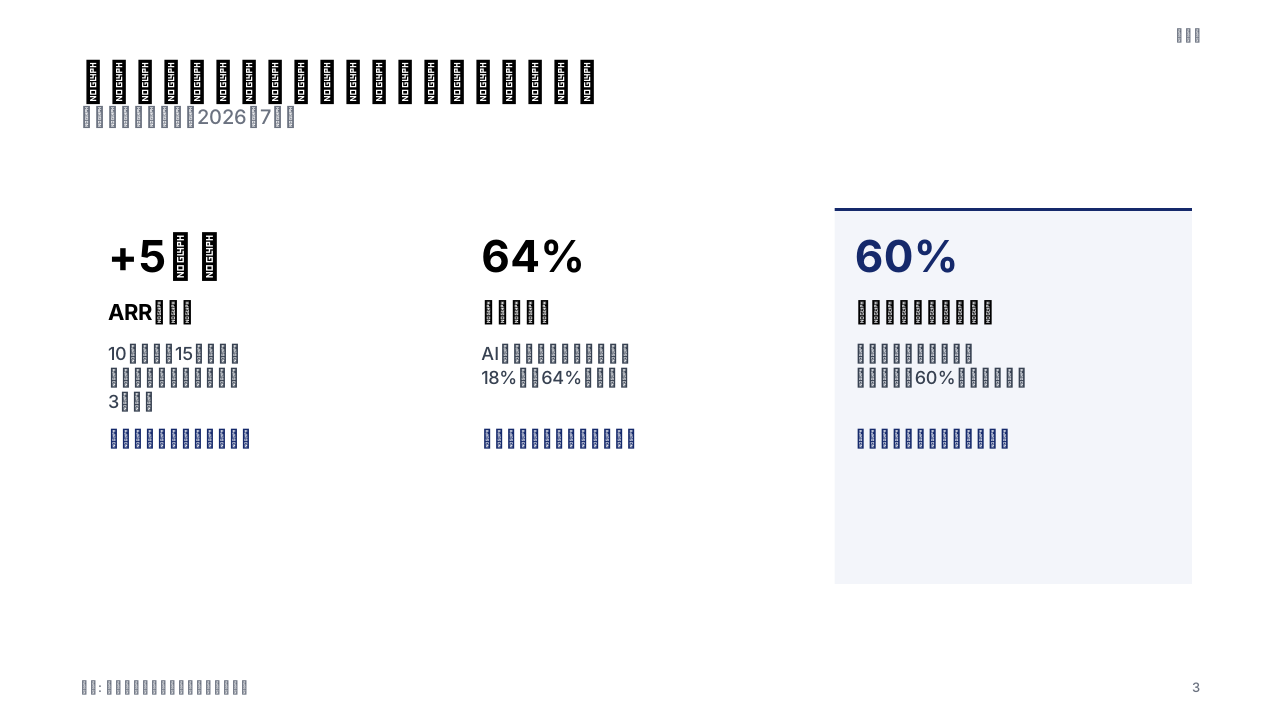
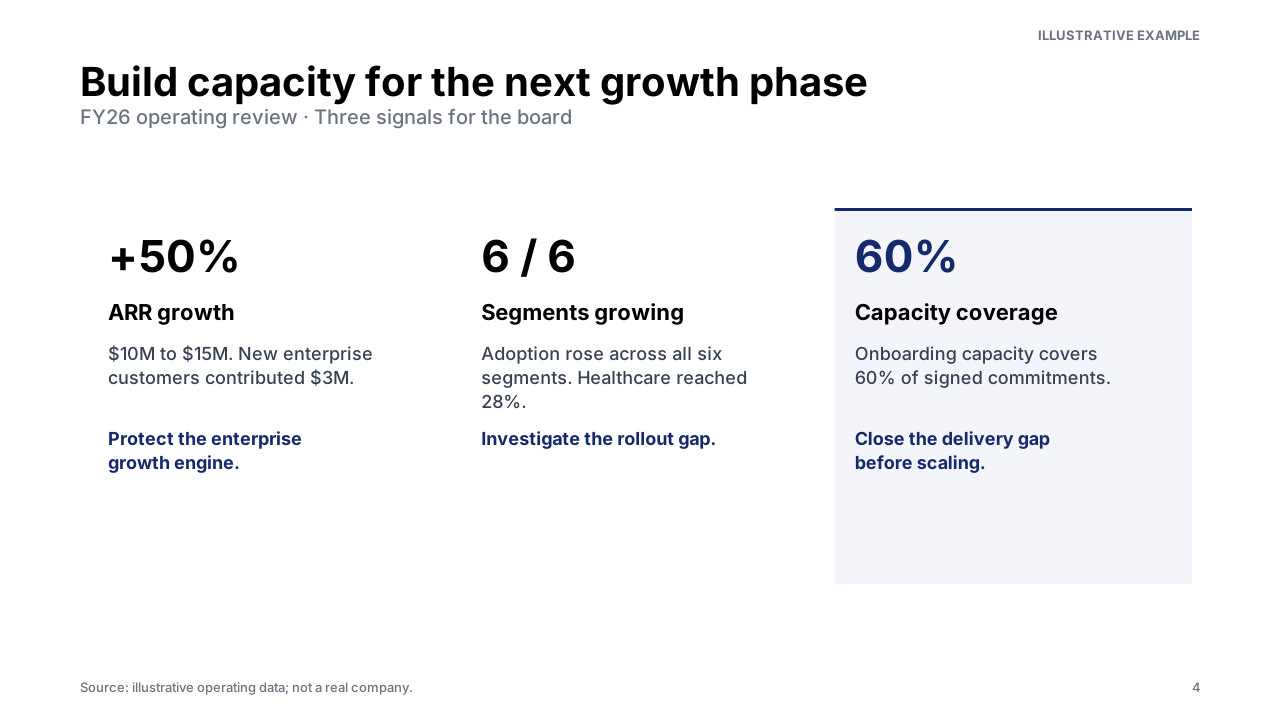
arr $10m → $15m (+50%)
new enterprise +$3m
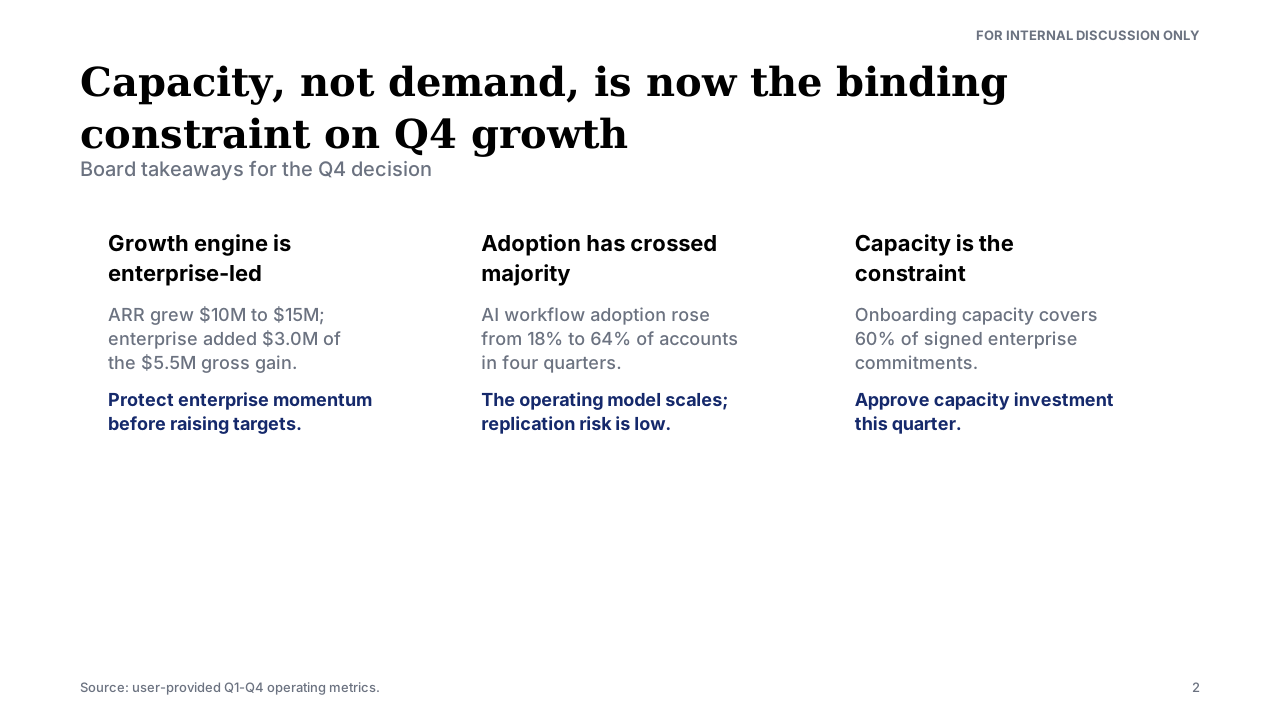
adoption up in all 6 segments
healthcare only at 28%
onboarding covers 60% of commitments

what should the board focus on?
Illustrative input
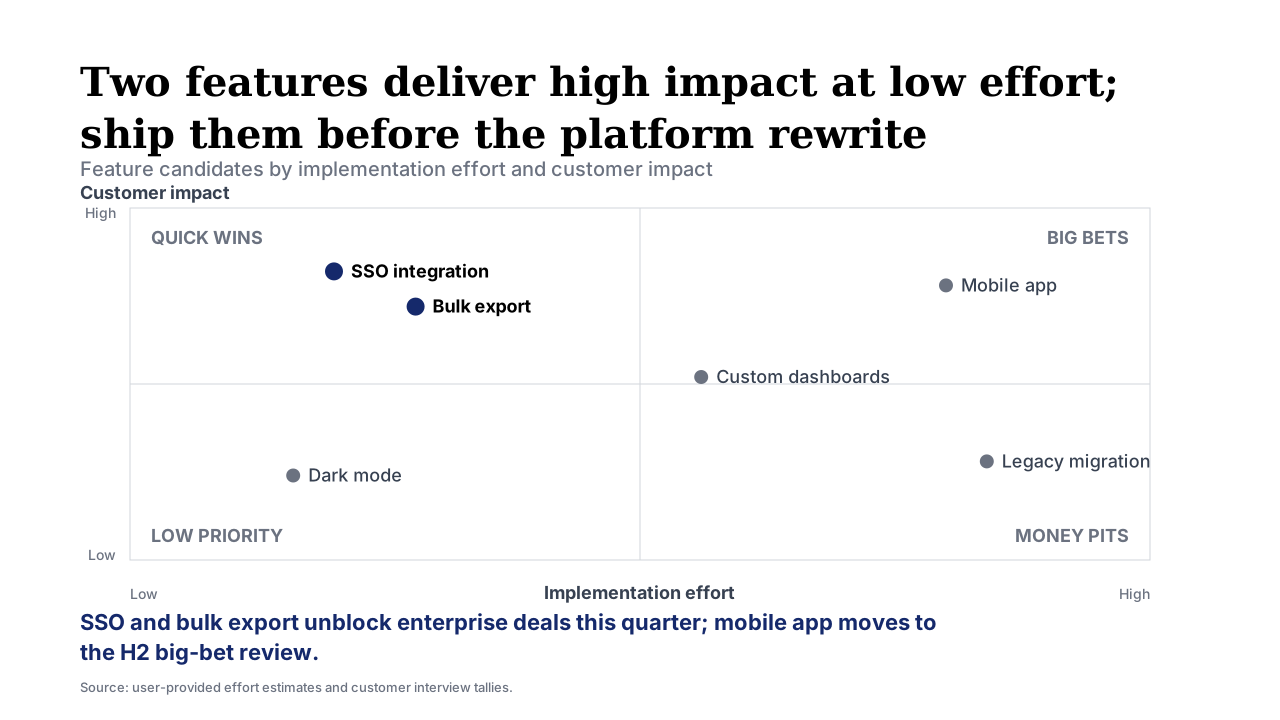
SSO: high impact, low effort
bulk export: same
mobile app: high effort
dashboards: medium
dark mode: low impact
legacy migration: high effort, low impact

where should product focus?
Illustrative input · Positions are illustrative estimates
Explore a complete nine-slide board deck. Every slide below is generated by the skill.
Real renderer output, playing in your browser — not a mockup.
A growth review for the board. A one-page decision brief for the operating committee. See the actual deliverables, built in HTML and exported to PDF.
Connect growth drivers, adoption and capacity to the decisions your board needs to make.
View the full deck · PDF ↗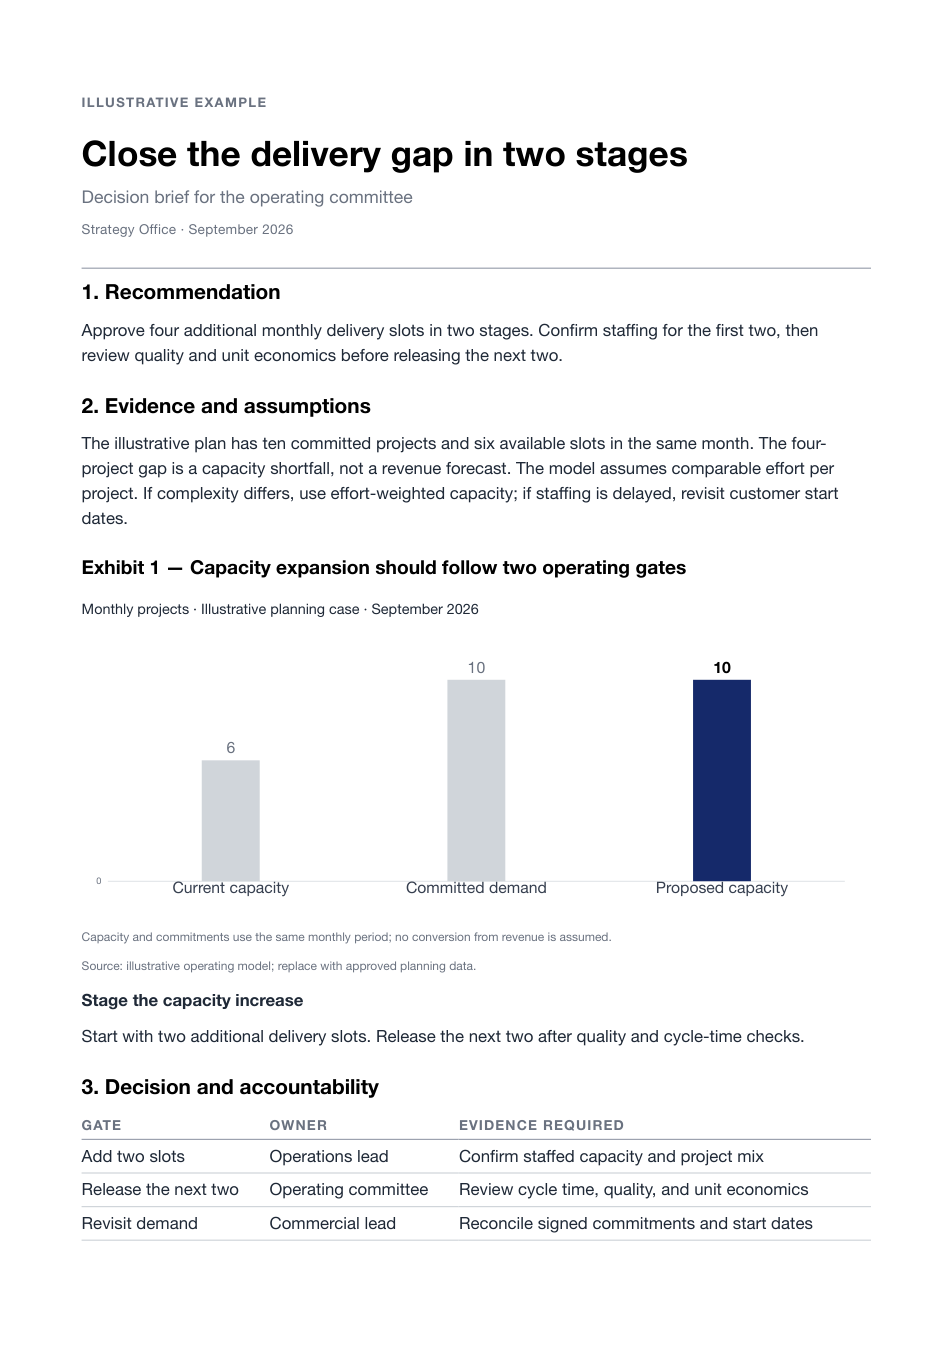
Put the recommendation, supporting evidence and accountable owners on one readable page.
View the one-page brief · PDF ↗Create in HTML. Share as PDF. Refine the narrative and charts with AI, review in your browser, and export the finished work.
Explore the consulting design study ↗Growth reviews, vendor comparisons, roadmaps. Start with a pattern built for the question.
Download the JSON and place it in your installed skill folder. Edit the labels and data, then run the command below. SVG previews open at full size.
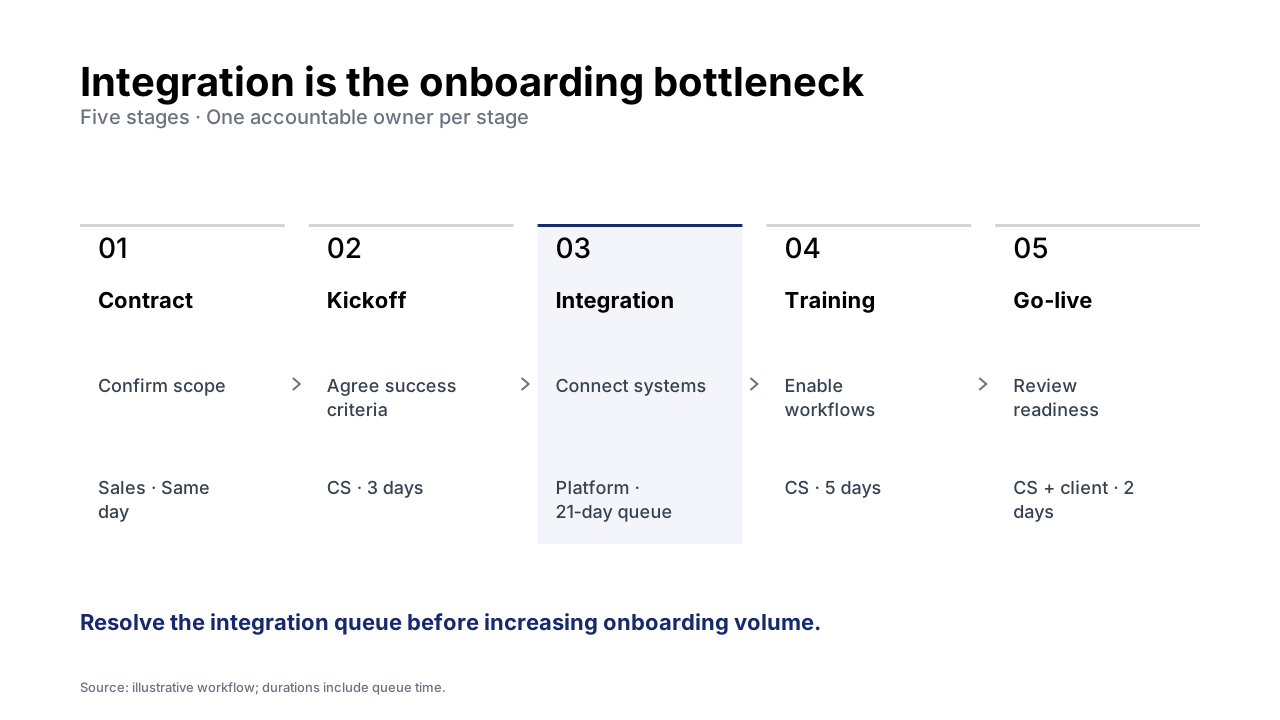
Show the steps, the owner, and the bottleneck.
python3 scripts/render_slide_spec.py onboarding-flow.json -o flow.svgCompare options without overlapping labels.
python3 scripts/render_slide_spec.py product-priority-two-by-two.json -o matrix.svg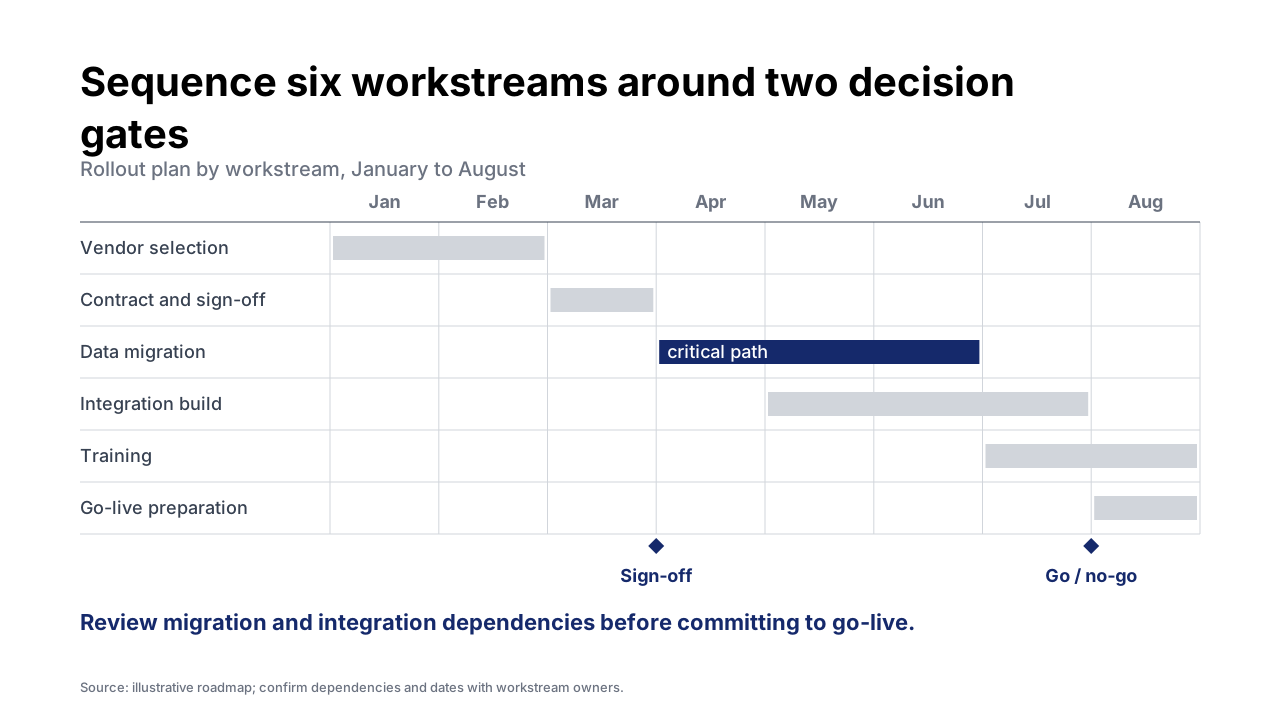
Align workstreams with dates and decision gates.
python3 scripts/render_slide_spec.py pmo-rollout-gantt.json -o roadmap.svgInsight-led headlines connect the evidence to the decision. Each slide has a job in the story.
Charts render from readable JSON. Trace the inputs, review the assumptions, and update the data.
Present an HTML deck, print to PDF, or insert SVG charts into PowerPoint. The local renderer needs no API key.
Slide spec (JSON)
Single-file Python scripts, standard library only. Specs version like code.
npx skills add kgraph57/mckinsey-style-visualization-skill
# For the runnable examples, clone and enter the repository:
git clone https://github.com/kgraph57/mckinsey-style-visualization-skill.git ~/.claude/skills/strategy-consulting-visualization
cd ~/.claude/skills/strategy-consulting-visualization
python3 scripts/render_slide_spec.py examples/render-specs/arr-waterfall.json -o slide.svg
python3 scripts/build_html_deck.py --manifest examples/demo-deck.json -o deck.htmlOr skip the terminal and just ask your agent.
Use the strategy consulting visualization skill to turn these notes into a board slide…